Charts
Draw a node output as a bar, line, point or other Vega-Lite chart in the Chart tab of the results panel. Charts are presentation: they read the retained result, never start a run and never make a result stale. Aggregate, bin and filter in SQL nodes, so that every plotted value is a cell of a node output and can be explained.
Add a chart
Charts are declared in charts.json, at the root of the project. For an output
without a chart, the Chart tab offers Add a chart to editors and
administrators: it saves a starter bar chart of the first two columns, with
tooltips, creating charts.json when the project has none, and opens the file
in the Code tab. Edit the spec
there, or in an external editor, then save. Readers, operators and read-only
branches such as Job results see the charts without this action.
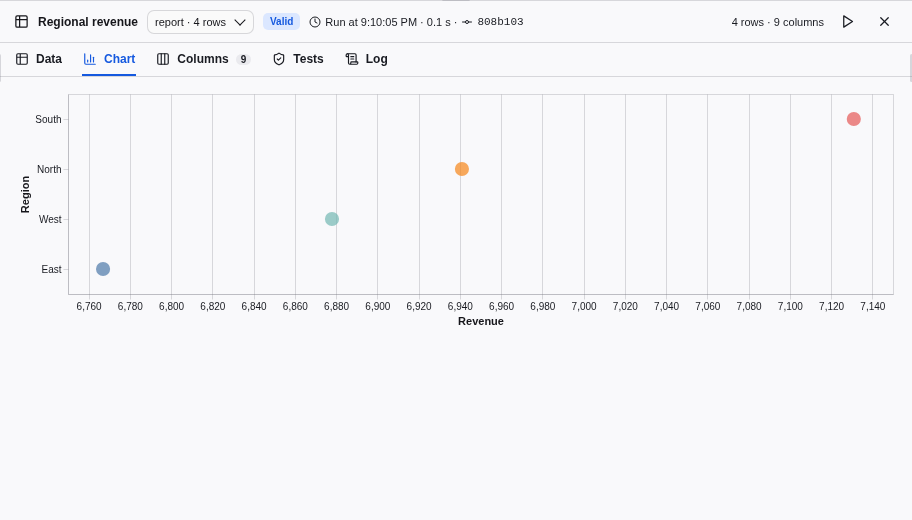
Editors and administrators can also ask the assistant to create, update, rename or delete charts. The Northstar example includes a chart on Regional revenue.
File format
charts.json maps a node output to a list of named charts:
{
  "report::rank:result": [
    {
      "name": "Revenue by region",
      "spec": {
        "$schema": "https://vega.github.io/schema/vega-lite/v6.json",
        "mark": {"type": "circle", "size": 200, "tooltip": true},
        "height": 200,
        "encoding": {
          "x": {
            "field": "revenue",
            "type": "quantitative",
            "title": "Revenue",
            "format": ",",
            "scale": {"zero": false}
          },
          "y": {"field": "region", "type": "nominal", "sort": "-x", "title": "Region"},
          "color": {
            "field": "region",
            "type": "nominal",
            "title": "Region",
            "legend": null
          }
        }
      }
    }
  ]
}- Keys name the output that stores the rows, as in
views.json:node:port, orinstance::node:portinside a component instance. Above,reportis the Regional revenue instance andrankits inner node. Selecting the instance or the inner node shows the same charts. - Entries have exactly a
name, 1 to 100 characters and unique for the output, and aspec, a Vega-Lite 6 view of at most 64 KiB serialized. Duckpad metadata stays beside the spec, never inside it. $schemais optional. When present, it is a Vega-Lite 6 schema URL:v6.jsonor av6.x.y.jsonvariant.datais optional. When present, it is exactly{"name": "data"}: Duckpad always supplies the rows of the output.
A field is a column name exactly as the output spells it, dots and brackets
included: write "field": "a.b" or "field": "x[0]", without Vega-Lite’s
\\. path escapes. Axes, legends and tooltips show the name as written.
With several charts, a selector above the chart switches between them by name.
A chart without width takes the width of the panel.
The example plots points on a revenue axis that starts near the smallest value
("scale": {"zero": false}): bars always start at 0, which hides differences of
a few percent. "tooltip": true on the mark shows the encoded values on hover;
a tooltip channel picks other columns.
Allowed specs
A spec must pass an allowlist. Anything outside it is reported as a diagnostic
naming the chart, its output and the first construct refused, such as
charts.json: chart Revenue by region of report::rank:result: encoding.x.aggregate is not allowed.
| Level | Allowed |
|---|---|
| Top level | $schema, data, mark, encoding, layer, title, description, width, height |
Layer, in layer | mark, encoding, title, description |
| Mark types | bar, line, area, point, circle, square, tick, rect, rule, text, arc |
| Mark object | type and the literals color, opacity, filled, size, strokeWidth, interpolate, point, orient, tooltip, innerRadius, outerRadius, cornerRadius |
| Channels | x, y, x2, y2, xOffset, yOffset, theta, radius, color, fill, stroke, opacity, size, shape, strokeDash, text, tooltip, detail, order |
| Channel definition | field, type, title, format, formatType, value, scale, axis, legend, sort, stack |
scale | type, domain, range, scheme, zero, nice, reverse |
axis | title, format, formatType, labelAngle, grid, orient, tickCount |
legend | title, format, formatType, orient |
Values follow these rules:
- A spec has a
markor alayer, and every layer has amark. widthandheightare a positive number or"container". Atitleis a string or an object withtextandsubtitlestrings.typeisquantitative,temporal,ordinalornominal;formatTypeisnumberortime. Aformatis a d3 number or time format without quotes or backslashes. A channeltitleis a string, ornullto hide it.tooltipmay be a list of channel definitions.sortis"ascending","descending",null, a channel name with an optional-prefix ("-y"), a list of literals, or{"encoding": "y", "order": "descending"}.stackistrue,false,null,"zero"or"center".axisandlegendmay benullto hide them.- Mark properties,
value, and thescale,axisandlegendproperties are literals: a string, a number, a boolean ornull.domainandrangeare lists of literals.
An object or a list where a literal is expected is refused, so {"expr": …} and
other expressions never reach the browser. Transforms, aggregate, bin,
timeUnit, impute, composite marks such as boxplot, sort by field or
op, stack: "normalize", datum, condition, params, href, url,
datasets, inline data, config, and facet, repeat or concatenated views are
not allowed. Compute in SQL what they would compute.
charts.json is checked when the project is validated. An invalid file is still
saved and committed, and its diagnostics appear with the other project problems.
Keys are only checked to be well formed: a chart of an output that no longer
exists is not reported, and deleting a node deletes its charts.
Rows and states
A chart plots the whole output, never a sample, and only outputs of at most 5,000 rows. Above that, the tab shows the row count and asks you to aggregate upstream: a truncated series would look complete. The Data tab’s sample, filter, search and sort do not apply; its partition selection does.
The tab follows the dataset shown in the results panel, inputs included, and the selected environment. It shows the same states as the Data tab: Stale with its reason, Run when there is no result, and the failure of the last run. It also reports a spec that Vega-Lite cannot compile and fields that the result has no column for, which Vega-Lite would otherwise draw as empty marks.
Axes and tooltips use the number and date formats of the interface language, and the chart takes the colors of the light or dark theme. The draft Preview of the code editor has no chart.
Values and dates
The tab converts each column by its type before drawing:
| Column type | Chart value |
|---|---|
Integers, floating point, DECIMAL, HUGEINT | Number. Very large integers and decimals can lose precision; infinity and NaN become null. |
DATE | Date at local midnight of that day. |
TIMESTAMP and its _S, _MS, _NS variants | Date with the same local wall-clock time, to the millisecond. |
TIMESTAMP WITH TIME ZONE | Date at that instant, shown in your time zone. |
BOOLEAN | Boolean. |
Anything else (TIME, lists, structs, maps, blobs) | Text; lists and structs as JSON. |
A DATE is drawn at local midnight on purpose: Vega would read 2026-10-01 as
midnight UTC, which shows as the previous day west of UTC. Use
"type": "temporal" to place dates and timestamps on a time scale.
Security
Project files reach browsers through branches, Git pulls, ZIP imports and external editors, so the browser applies its own barriers on top of validation:
- No chart while
charts.jsonis invalid. The tab lists the diagnostics, with a link to the file in the Code tab, and draws nothing. - No network or file access. Charts use a Vega loader that refuses every request; a chart only draws the rows Duckpad supplies.
- No generated code. Vega expressions run in
vega-interpreterrather than being compiled to JavaScript, and the actions menu, which could open the spec in an online editor, is hidden. - Text tooltips. A tooltip shows its values as escaped text, never as HTML or as an image a value points to.
- Pinned versions.
vega6.4.0,vega-lite6.5.0,vega-embed7.3.0 andvega-interpreter2.3.2 are upgraded only deliberately. Vega loads when the Chart tab first opens.
Git, components and comparisons
- Merge: charts merge by output and name. Charts added to the same output on two branches both survive; a chart is merged as one unit, so different edits to the same chart, or a deletion against an edit, are one conflict resolved by choosing a side.
- Comparison and Git review: each chart is listed as “Revenue by region chart of report::rank:result”, with a JSON diff.
- Components: grouping nodes moves their charts to the new instance, and deleting a node or an instance deletes its charts. Charts belong to the instance; they are not copied into the component definition.
- ZIP archives include
charts.jsonwith the other project files.